


By Jodie Gunzberg, CFA, Managing Director, Head of U.S. Equities, and Garrett Glawe, CFA, Director, Asset Owner Channel, S&P Dow Jones Indices
The Russell 2000 has benefited from a long history and has become the dominant benchmark for active US small-cap equity managers. However, it can be argued that the broad adoption and makeup of the Russell 2000 do not make it more valuable as a performance benchmark or for active to passive replacement.
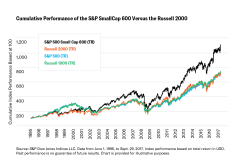
The S&P SmallCap 600 has outperformed the Russell 2000 over short and long time horizons, through various bear and bull markets, and largely on a monthly and annual basis. Additionally, the S&P SmallCap 600 ranks higher than the Russell 2000 in peer group analysis and has provided returns on par or better than active managers in many time periods. These results are not a coincidence, given that the S&P SmallCap 600 has quality built into its eligibility criteria.
In a move to increase transparency and liquidity, and to provide lower fees to market participants, the S&P SmallCap 600 should be considered the small-cap benchmark of the industry, according to the authors of this paper. Based on its performance, the S&P SmallCap 600 may set the bar higher for active managers and increase the quality of passive small-cap investing.
WHY THE S&P SMALLCAP 600 OUTPERFORMS THE RUSSELL 2000

The S&P SmallCap 600 only has 601 stocks, while the Russell 2000 has 2,010, and the weighted average market cap of the S&P SmallCap 600 is US$1.77 billion compared with US$2.05 billion for the Russell 2000. Also, the ROE may contribute to the performance differential, with a ROE of 9.7 for the S&P SmallCap 600 versus 5.9 for the Russell 2000.
Extensive research has been done on the small-cap risk premium and how it has changed over time. In addition to the research done at S&P Dow Jones Indices on the factors that drive small-cap performance, the authors of a paper for AQR Capital made a strong case that, once what they define as “quality” is controlled for, a stable and significant small-cap premium emerges.
There are important construction differences between the S&P SmallCap 600 and the Russell 2000. One key difference may be the earnings requirement that the S&P SmallCap 600 implements, which plays an important role in how the index defines quality.
The S&P SmallCap 600 quality effect can be observed in the four-factor (various measures of profitability, growth, safety, and payout) regression that adds quality to the three original factors identified in a 1993 edition of Journal of Economics: market, size, and value. The coefficient to the quality factor is statistically significant for the S&P SmallCap 600, but not for the Russell 2000. This shows the power of quality in driving the outperformance of the S&P SmallCap 600.
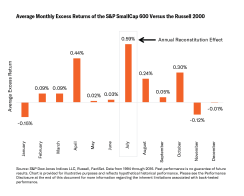
The other key methodology difference that drives the outperformance of the S&P SmallCap 600 versus the Russell 2000 is the annual reconstitution effect that dilutes Russell 2000 returns. It, too, has been well documented, not only in a report by S&P Dow Jones Indices showing the significant t-stat of the return difference of the indices, but also by several other well-known researchers.
As winners from the Russell 2000 graduate to the Russell 1000, and losers from the Russell 1000 move down to the small-cap index, fund managers are forced to sell winners and buy losers, thereby creating a negative momentum portfolio. Researchers have estimated that the predictable nature of the June Russell rebalancing process biases the return of the index downward by an average of approximately 2% per year – separate research found the rebalancing impact to be 1.3% per year.
Together, quality and reconstitution account for most of the S&P SmallCap 600’s outperformance over the Russell 2000. Some of the return difference may also be associated with the liquidity criterion of the S&P SmallCap 600 that is not applied to the Russell 2000. Within the S&P SmallCap 600, a small percentage of stocks (roughly 3%) have a three-month average daily trading volume (ADVT) of less than US$1 million, compared with about 15% of stocks in the Russell 2000 that have a three-month ADVT of less than US$1 million.
To read the full paper go here.


