

Over the past quarter century, many market pundits have asked the age-old question – has private equity outperformed public markets over the long term? As we enter 2025, we thought no better time than now to look back at private equity performance relative to public markets over the past 25 years. We dug into this question further and examined the performance of both asset classes over this time period.
Our analysis suggests that not only did private equity outperform public markets, but the opportunity cost of missing out was significant. To be clear, we are focused on buyout private equity, not venture capital or growth in our analysis.
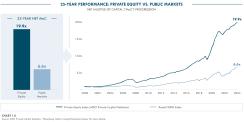
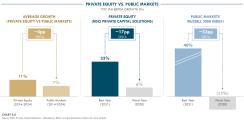
In fact, since 2000, private equity has generated a net annualized time-weighted return of 13%, according to MSCI Private Capital Solutions. This compares favorably to public equities (Russell 3000) which has generated an 8% net return. We specifically chose the Russell 3000 to help mitigate against the impact of the magnificent seven. This represents outperformance of 486bps of incremental net returns. But even more compelling in our view is what multiple-of-capital (“MoC”) or total dollars investors would have generated should they have compounded since 2000 at each rate of return.
In short, private equity investors would have generated a 19.9x net return on their money versus public market investors at 6.6x (see Chart 1.0). Said differently, had one invested across private equity instead of the public markets, one could have generated 3x more wealth.
In this paper, we dive into how we believe this has come about. Specifically, we detail our views on (i) the consistency of long-term outperformance of private equity returns, (ii) the sources of alpha in private equity, and (iii) the lower volatility of private equity returns being driven by the operating model of the asset class versus public markets.

The Consistency of Private Equity Outperformance
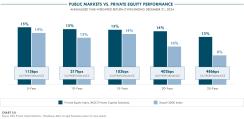
And it is not just that 25-year performance figures favor private equity, we further validated the thesis of consistent outperformance across cycles and time periods. Simply put, we could not find a sustained period of time in which private equity did not outperform public markets. Specifically, when examining 5-, 10-, 15-, 20- and 25-year private equity returns relative to public market returns, private equity outperformed in each period (see Chart 2.0).
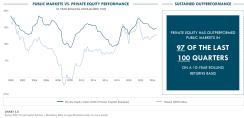
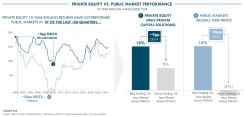
We then explored if investing at different times throughout the last 25 years may yield different results. We looked at 10-year rolling annualized net time-weighted return data (Chart 3.0).
The results were stark. In 97 out of the last 100 quarters, private equity was tracking to higher 10-year net returns than public markets. Of the three quarters of underperformance, private equity net returns superseded public markets in the quarter immediately thereafter. This data would suggest private markets have consistently generated stronger net returns than the public market over the medium-to-long term. Said differently, one did not need to “time the market” in its entry to private equity.
The Sources of Alpha in Private Equity: Buying Well, Building Well and Selling Well
Naturally, the next question is how has private equity been able to sustain this outperformance? We believe there is an alpha in private equity which drives stronger returns than public equities. And we believe this alpha can be characterized by private equity’s ability to (i) buy well, (ii) build well, and (iii) sell well.
Buy Well
First, our analysis suggests private equity buys well.
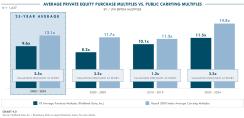
Over the past 25 years, buyout transactions were completed at an average EBITDA multiple of 9.6x, according to PitchBook Data, Inc. This compares to the public market index valuation of 12.1x EBITDA on average (see Chart 4.0). In other words, private equity has bought on average at a 2.5x discount to broader public market index valuations.
One may ask if the spread in valuation has eroded over time. Put simply, it has not. Across cohorts from (i) 2000-2009, (ii) 2010-2019, and (iii) 2020-2024, there has been a sustained spread between private equity buyout entry multiples and broader index valuations. In fact, the last five years had a larger public to private spread than the decade prior. For those concerned that private equity lost its pricing discipline relative to public markets as private equity dry powder increased over the past five years, our analysis suggests it has not.
Build Well
Secondly, our analysis suggests private equity builds well.
In order to test private equity’s ability to enact value creation in the context of this paper, we analyzed a specific investment type – public-to-private transactions – where a private equity manager completes the buyout of a public asset.
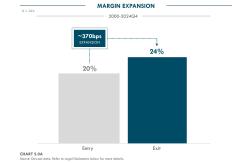
In other words, could private equity improve the operations of a public asset? At Dawson, we hold a database of 224 unique realized public-to-private transactions across 29 private equity managers. We found that on average, these companies that were taken private improved EBITDA margins by 370 bps (20% to 24%) (see Chart 5.0A). This suggests that value was likely created through private equity ownership.
Sell Well
Third, our analysis suggests private equity sells well.
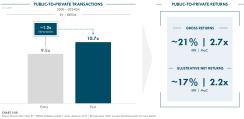
Across the same set of public-to-private transactions, the average purchase multiple – what private equity managers paid for the asset from public investors – was 9.5x EBITDA. However, at the time of sale, the EBITDA valuation multiple increased by 1.2x, to 10.7x (see Chart 5.0B). Ultimately these assets generated gross returns of ~21% IRR / 2.7x MoC on average (or illustrative net returns of ~17% IRR / 2.2x MoC). While we are not suggesting that the analysis is idiosyncratic or that performance is solely driven by private equity ownership, we argue that private equity plays a role in improving businesses and positioning them more favorably at exit compared to entry.
Volatility of Private Equity Relative to Public Markets
Some may analyze the findings above and come to the common conclusion that “higher returns from private equity stems from taking on greater risk”. And that greater risk must mean more volatility, particularly since private equity tends to use more leverage than public markets. However, at Dawson, we had observed the opposite, that private equity had been generating higher returns with less volatility. We got curious as to why this may be.
In fact, when looking back, we would make the case that private equity has been less volatile than public markets. In evaluating volatility over the medium-to-long term, we analyzed the 10-year rolling annualized net time-weighted returns for both public and private indices and assessed the spread between the best and worst performing quarters within that period. The best performing quarter for each index was, coincidentally, an ~18% net return. However, the worst-performing quarter for private equity was a gain of 9% while public equities saw a decline of 2%. One could view this as private equity generating the same returns with half the volatility relative to public markets (see Chart 6.0).
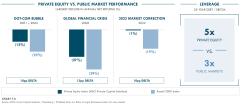
We then looked at three periods of volatility over the past 25 years: (i) the dot-com bubble, (ii) the GFC, and (iii) the 2022 market correction. Specifically, we looked at whether having higher incremental leverage on private equity assets versus public equity over those periods resulted in more pronounced short-term volatility. Based on our analysis, the answer is a resounding no. Public equities experienced larger declines in returns, of at least 1,000bps, relative to private equity (see Chart 7.0).
So we asked ourselves. How could an asset class with higher leverage and stronger returns also be less volatile?
To answer this, we looked to the underlying operating performance of the assets in each index (Chart 8.0). Over the past 10 years, private equity assets have on average generated last-twelve-month (“LTM”) EBITDA growth of 11%, according to MSCI Private Capital Solutions. This compared favorably to the public equity index of just 7%. Simply put, private equity has outperformed public markets in earnings growth over the past decade. For us, this suggests it builds better businesses.
But it is not just EBITDA growth that is important. We believe it is also the resilience of EBITDA through cycles. To that end, we looked at the best and worst years of EBITDA growth for each asset class during the past decade. Based on our analysis, private equity EBITDA seems vastly more resilient than that of public market companies. Private equity’s best year was 2021 when average EBITDA grew 23% while its worst year was 2020 with average EBITDA growth of 6%. A spread of 17% in growth rate. Meanwhile, public market companies exhibited greater EBITDA volatility. From its best year in 2021 with 40% average growth to a 13% decline in 2020, its worst year. That equates to a 53% spread in growth rates, or 3x more volatility than private equity.
What we believe this analysis suggests is twofold. First, private equity assets generated stronger operating performance on average, which could help drive stronger returns. Second, the operating performance in private equity may be more resilient, which could help reduce the spread in returns noted over the long term, and specifically during periods of market volatility. All of this despite higher incremental leverage.
Enabled by a Better Operating Model
A natural question that arises is how has private equity consistently achieved superior operating performance? We believe this is enabled by a fundamentally stronger operating model compared to public markets, primarily driven by (i) deeper engagement, (ii) sharper focus, and (iii) better governance. In our view, these advantages not only position the asset class to respond more effectively to market shocks but also enable stronger long-term value creation potential.
Deeper Engagement: Private equity firms tend to utilize institutional experience to help proactively identify, diligence and oversee their portfolio companies, sometimes engaging directly in daily operations. In contrast, public investors are often driven by algorithmic trading and generally have minimal influence over the operations of the companies in their portfolios.
Sharper Focus: In our view, private equity’s sharper focus is often made possible due to a more concentrated investor base in private equity-backed companies, which can include management and private equity firms as its largest owners. This concentration can create an alignment of interests and focus on the go-forward performance of the asset. In contrast, public companies have a more diverse investor base with potentially differing objectives, time horizons, and incentives.
Better Governance: Private equity represents more long-term capital, typically dedicated to the multi-year growth and development of businesses. On the other hand, public markets tend to have a short-term focus, often prioritizing quarterly performance and momentum. Is a focus on short-term quarterly earnings the best way to manage a company to long-term success? We think not.
Final Thoughts
Our analysis and data has led us to a few potential conclusions.
First, over the past 25 years, private equity has consistently outperformed public markets. This resulted in a significant opportunity cost to not investing in private equity. In fact, investing in private equity in 2000 would have generated 3x more wealth relative to public markets over the past quarter century. Private Equity has outperformed consistently over the last 5-, 10-, 15-, 20- and 25-year periods and in 97 out of the past 100 quarters.
Second, we believe this is in large part driven by the private equity operating model. The model focuses on (i) stronger engagement and involvement in underlying companies, (ii) a more concentrated investor base, and (iii) more patient, long-term capital. In our view, this has allowed private equity to buy well, build well, and sell well.
Third, private equity returns have not only been stronger but also less volatile, which resulted in an attractive risk-adjusted return for the asset class. To us, this is evident in the short, medium, and long-term, which could be at least partially attributable to the consistent and higher EBITDA performance at the asset-level versus public market counterparts.
How will private equity perform over the next 25 years? Given the fundamentals of the asset class and historical performance, we believe private equity is well-positioned to sustain its outperformance versus public markets over the long term.
Legal Disclaimer: Based upon Dawson’s current views informed by published sources and third parties outside Dawson. No assurances can be made that historical trends will continue or that expectations will materialize. Past performance is not indicative of future results. MSCI Private Capital Solutions (MSCI) data is as of September 30, 2024, Bloomberg data is as of December 31, 2024, and PitchBook Data, Inc. (PitchBook) data is as of January 10, 2025. MSCI, Bloomberg and PitchBook represents all available data within certain criteria including geography, fund or transaction size, vintage and strategy. Different criteria would yield different results. All Russell 3000 data is inclusive of dividend reinvestment and withholding tax deduction on dividends. Given MSCI data for 2024Q4 is not yet available, all MSCI data in Chart 1.0, Chart 2.0, Chart 3.0, Chart 6.0 and Chart 7.0 is inclusive of a 2% estimated uplift for 2024Q4, which would be in-line with the uplift for Russell 3000 over that same period. Data in Chart 4.0 and leverage data in Chart 7.0 was sourced from PitchBook as there was no available data from MSCI. Data in Chart 4.0 for private equity acquisition multiples reflect transactions >$500M in purchase price. Data in Chart 5.0A and Chart 5.0B is from Dawson’s internal database as there was no available data from MSCI or PitchBook. Data for EV / EBITDA valuation multiples exclude 7 transactions which were valued on an EV / Revenue basis. EV / Revenue valuation is used for assets with entry EV / EBITDA multiples of >50x or <0x. Asset-level illustrative net return metrics are estimated by applying an 80% gross-to-net ratio to estimate the impact of fees and carry, which Dawson views as reasonable based on its analysis. In Chart 7.0, private equity debt / EBITDA is at entry (PitchBook) and public markets is average leverage multiple (Bloomberg), given available data.
