

Dr. Mark Shore, CME Group
At a Glance:
- Data suggests commodity prices have a relatively high positive correlation to the Personal Consumption Expenditures (PCE) price index.
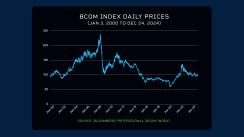
- Since 2000, commodities have seen both rallies and declines, as tracked by the Bloomberg Commodity Index (BCOM), which covers 24 agricultural, energy and metals products.
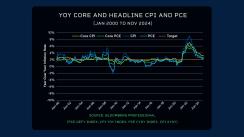
As commodity prices fluctuate in response to supply and demand, and inflation continues to rise, a key question arises: How closely do commodity prices track inflation indicators?
Since the financial crisis, core inflation remained stable around the PCE’s 2% target until April 2021 when inflation surged globally due to pandemic-related supply chain disruptions and changing consumption patterns. By summer and fall 2022, inflation peaked between 5.6% and 9.1%, depending on the index. Inflation began to decline, reaching a temporary low in late 2024.

The Bloomberg Commodity Index (BCOM) hit its lowest point in March and April 2020, rebounded to pre-pandemic levels by January 2021 and peaked in June 2022. BCOM then declined by about 32%, hitting a recent low in September 2024, returning to August 2021 levels.
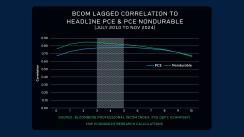
From July 2010 to November 2024, the year-over-year correlation between BCOM and the PCE index was 0.68. The correlation with the PCE’s nondurable subsector (food and energy) was 0.76.
Since it takes time for commodities to make their way through the supply chain and potentially impact consumer prices, lagging the data by three to five months found the correlations increased to 0.78 to the PCE index and 0.85 to the PCE nondurable sector.
These relationships will be essential to track as they continue to shape market dynamics and economic outcomes.
CME Group futures are not suitable for all investors and involve the risk of loss. Full disclaimer. Copyright © 2025 CME Group Inc.


