Quantitative approaches to equity investing continue to introduce new sources of alpha. Recent advances in computing power, such as machine-learning and natural language processing are generating insights in areas formerly reserved for human research.
This has enabled increased analysis of non-traditional data sets that may provide valuable investment insights and a competitive edge amongst active equity investors.
Quantitative investing as we know it today originated in the 1980s with the formation of several quantitative investment firms, many of which are still thriving today. This fledgling industry benefited from a unique set of conditions:
- Financial data was now available in digital format.
- Computing power allowed them to do quantitative analysis that was previously incredibly tedious.

Fast forward to 2024, and portfolio optimizers now use sophisticated non-linear optimization algorithms, allowing them to handle complex functions and constraints more effectively. The algorithms have also become more efficient, using a technology called parallel processing that enables unprecedented scalability. This allows quant managers to optimize much larger portfolios with thousands of securities in their universes.
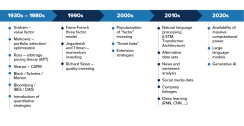
Modern quantitative investing: 100 years in the making
Novel data sets: Non-traditional sources of data from which investors can generate investment insights.
Natural language processing (NLP): The analysis of text data using computers to extract information from text-based regulatory filings and earnings call transcripts.
Large language models (LLM): AI-powered language models that can be used to query information from a large set of textual data or analysis.
Generative AI: Models that can generate new, original content rather than simply analyzing existing data or making predictions.
Cloud computing/GPU computing: Allow quantitative investors to access massive computational power that allows quants to achieve in hours what used to take days.
These machine learning technologies all contribute towards the production of investment signals, also referred to as alpha signals. Investment signals produce stock-specific alpha scores that quants use as an input into their investment models to predict future price movements. They are utilized as a component of – or an addition to – traditional academically supported investment factors, such as value, quality and growth.
Utilization of quantitative factors and alpha signals
Quantitative factors and investment signals are quantifiable characteristics or metrics used to assess the attractiveness of investing in a security.
One of the earliest known factors is the value factor, introduced by Benjamin Graham in his book “Security Analysis” (1934). Graham introduced into the collective consciousness of investors the idea of using a number associated with a company (e.g., price-to-earnings ratio) to make investment decisions.
In 1992, the Fama-French three factor model was introduced by Eugene Fama and Kenneth French, where they combined size, beta and value in a model used to predict stock returns. The following year, Narasimhan Jegadeesh and Sheridan Titman laid the foundations for momentum investing in a paper titled “Returns to Buying Winners and Selling Losers: Implications for Stock Market Efficiency”.
In the years following, academics and practitioners discovered a plethora of factors, populating what we now call the factor zoo, falling into broad classifications of factors such as value, momentum, growth, quality and technical. Without question quants today still rely heavily on academically supported factors as inputs to their models. But they are increasingly utilizing machine learning and novel-data-set driven investment signals in their models. The following table compares some common established factors with a few examples of the newer investment signals used today.
Factors vs. Investment Signals
- They need to make fundamental and intuitive sense.
- They need to have statistical significance in the predictive models they are part of.
- They should have persistent efficacy.
- They should have widespread efficacy across different geographies and sectors of the economy.
- They should be as uncorrelated to existing factors as possible. Adding highly correlated factors is unlikely to improve the overall predictive power of a model significantly, as it already contained information from highly similar factors. Uncorrelated factors inject fresh and more effective perspectives and novel insights into the model.
Although perhaps counterintuitive, all of these rapidly evolving tools, data sets, and investment signals require more human oversight, not less. It is critical that quantitative investors apply their experience and expertise to the entire process to help ensure that their data and model outputs make strong fundamental sense and lead to sound investment decisions.
As we continue to push the boundaries the pursuit of alpha will continue, perpetuating the relentless search for new sources of insight and opportunity.
[DISCLAIMER]
Issued by Mackenzie Investments Corporation (“Mackenzie Investments”). For institutional use only. This material is provided for marketing and informational purposes only and does not constitute investment advice or an offer of investment products or services (or an invitation to make such an offer). Certain information contained in this document is obtained from third parties. Mackenzie Investments believes such information to be accurate and reliable as at the date hereof, however, we cannot guarantee that it is accurate or complete or current at all times. The information provided is subject to change without notice and Mackenzie Investments cannot be held liable for any loss arising from any use of or reliance on the information contained in this document. No portion of this communication may be reproduced or distributed to anyone without the express permission of Mackenzie Investments. Past performance — and especially any simulated past performance contained herein — is not necessarily indicative of any future results. Composite performance does not necessarily reflect the performance that any particular account investing in the same or similar securities may have had during the period. The performance of other accounts is likely to differ from the performance shown for a variety of reasons, including, but not limited to: differences in market conditions, portfolio turnover and in the number, types, availability and diversity of securities that can be purchased; economies of scale, regulations and other factors applicable to the management of large separate accounts and funds; client-imposed investment restrictions; the timing of client investments and withdrawals; the deduction of taxes; tax considerations; and other factors. Information regarding portfolio characteristics relates to a representative account within the composite. Gross returns do not reflect the deduction of advisory fees. Net returns reflect the deduction of the highest investment advisory fee for the strategy. All returns are net of transaction costs but do not include the deduction of custody fees or other (non-advisory) costs, fees and expenses that may be incurred in managing an investment account. A portfolio’s return will be reduced by costs, fees and expenses and their impact can be material. Returns assume the reinvestment of dividends, interest, and realized and unrealized capital gains and losses. Index returns do not reflect transaction costs, or the deduction of other fees and expenses and it is not possible to invest directly in an index. Further details on transaction costs or estimated dividend withholding taxes is available upon request. Simulated performance information is backtested and generated with the benefit of hindsight. Hypothetical and backtested performance almost invariably shows better returns than actual performance. Readers should: (i) recognize that any future performance will likely be inconsistent with, distinct from, and lower than that shown; and (ii) not base any investment decision solely upon this information. Actual returns achieved will vary and could be materially lower than the returns reflected in this material.