Our analysis suggests that private equity could be in for a very interesting chapter; says Dawson managing partner, Yann Robard
At Dawson, we believe that private equity may be entering what we are calling a “super cycle”. Over the next 12 to 24 months, we believe that we will see two things:
- private equity will generate returns that exceed those of public markets, and
- distributions from private equity portfolios will return to more normalized historical levels (2x to 3x 2023 levels).
Our prediction on performance is driven by (i) analysis that compared this current cycle to that of the global financial crisis ("GFC") and (ii) reviewing private equity and public market earnings and multiples over the last 18 months. We found both this cycle and the GFC have had striking similarities thus far in their evolutions. We also found that private equity company earnings have grown at nearly twice the rate of public markets over the past 18 months. Despite this, private equity companies are being held at a nearly 2.5x valuation multiple discount as compared to public markets. Should markets normalize over the next 12 to 24 months, as we at Dawson expect to be the case, we believe this provides the necessary ingredients for private equity to potentially outperform public markets.
We also believe that liquidity is returning to private equity. In April of this year, we said that liquidity may be on the horizon. We made a bold prediction in the midst of a drought of distributions that we would see liquidity recover in the second half of 2024. This prediction was also based on a comparative analysis of this cycle and the GFC. While still early, market chatter suggests liquidity is returning and we are already seeing early signs that we may be proven right. Time will tell.
We elaborate further on both performance and liquidity in that order below.
Performance: Parallels to the GFC

We believe reviewing prior cycles can help one better contextualize where we may be today in the current market cycle. As we have done in the past in other whitepapers, we turned once again to the GFC to help guide our perspective. While we acknowledge that every cycle is different, we did find some striking similarities between the GFC and this current cycle.
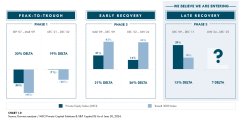
In disaggregating the GFC, we found it helpful to break the cycle into three distinct phases. See Chart 1.0.
- Peak-to-Trough: Public markets declined drastically as private equity declines were more muted.
- Early Recovery: Public markets recovered aggressively from their lower troughs while private equity's recovery was more muted given it had fallen less.
- Late Recovery: Private equity generated returns that exceeded those of public markets.
We believe Phase 1 and 2 of this cycle are now behind us and we are entering Phase 3 of this cycle, potentially positioning private equity to generate excess returns to that of public markets.
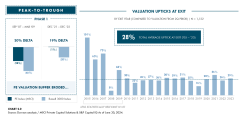
Phase 1: Peak-to-Trough
In the first stage of both cycles, public market returns fell more drastically than private equity. This was true in the GFC when public markets declined 48% while private equity declined by a more muted 28% over the same period. Similarly, in this cycle, public markets declined by 20% while private equity declined a more muted 1% from peak-to-trough over the same period. Interestingly, both cycles resulted in a ~20% difference between private equity and public market declines. See Chart 2.0.
This discrepancy led many to question the valuation methodologies of private equity. At times claiming that private equity valuations are “overvalued”, “opaque” and “irrational”. We at Dawson felt the need to defend private equity valuations in a whitepaper we released in February 2024 titled “Coming to the Defense of Private Market Valuations”.
We made the case that private equity tends to undervalue their assets, as evidenced by the data we analyzed which showed an average 28% “pop” in valuation at exit when compared to their value two quarters prior. This “pop” was exhibited consistently through both up and down markets and through cycles. And we pointed to this as evidence that we believed that private equity was, in fact, undervalued, not overvalued, as market sentiment suggested at the time. See Chart 2.0.
Could it be that during the first phase of the cycle, private equity is just experiencing an erosion of its “valuation buffer”, rather than private equity being overvalued?
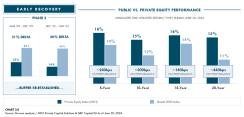
In the second phase of both cycles, which we are calling the early recovery, data shows that public market returns recovered much more aggressively than private equity. This makes intuitive sense to us given the public markets’ precipitous declines relative to private equity during Phase 1. Given public markets start from a much lower base, they have more to recover from.
This was, once again, observed in both cycles. In the early recovery of the GFC, public markets soared 42% while private equity generated a more muted 21% over the same period. Similarly, in this current cycle, public markets increased by 40% as private equity increased by an estimated 14%. See Chart 3.0. This is now leading some to question the relative performance of private equity, more specifically that private equity might be underperforming relative to public markets. Ultimately, this could lead some to question private equity's ability to generate long term outperformance. But, from our perspective, it is important for one to look at through-cycle returns rather than returns in a moment in time.
So this is precisely what we did, we reviewed medium- to long-term returns of private equity versus public markets over the last 20 years. Simply put, we could not find a sustained period of time during which private equity has not outperformed public markets. Specifically, when examining 5-, 10-, 15- and 20-year private equity returns relative to public market returns, private equity has consistently outperformed public markets. In our view, the conclusion is clear. Over the long-term, private equity outperforms public markets.
Where the idiosyncrasies of private equity versus public markets performance primarily lie is in the short-term performance, usually in 1- to 3-year performance figures. As public markets swing, generally with more volatility than private equity, private equity valuations tend to lag public markets. Any short-term underperformance of private equity, we believe, is driven by timing and valuation lags. Over the long term, however, we believe the data shows that this resolves itself.
Phase 3: Late Recovery
Naturally, one may wonder “What might happen next in this cycle?” Assuming Phase 1 and 2 of this cycle are now behind us and looking back to the GFC to inform ourselves, Phase 3 of the cycle is when private equity generated outperformance relative to public markets. Can history repeat itself?
If so, this should be an interesting next 12 to 24 months for private equity. In fact, during the GFC, private equity returns increased by 29% while public markets generated only 14% during a similar timeframe. Said differently, private equity outperformed public markets by a factor of two. And this is the phase we believe we may be entering at this time. Considering this, we asked ourselves what could propel private equity to generate such outperformance over this next phase for history to repeat itself.
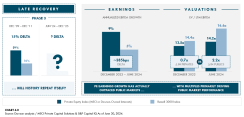
To do this, we looked back to the recent public market recovery over the past 18 months to try to determine the drivers of this recovery. Specifically, we focused on two factors in our analysis - (1) earnings growth and (2) valuation multiples - to help determine what drove public markets to rise 40% while private equity generated a more muted 14% increase during this period. See Chart 4.0.
We first reviewed annualized earnings growth (EBITDA) between December 31, 2022 and June 30, 2024. Data shows that private equity companies’ annualized earnings grew on average 9% while public market companies grew at just 5%. Said differently, private equity companies’ earnings grew nearly twice as fast as the public markets. From an earnings perspective, private equity appears to have outperformed public markets in this period. We then looked at valuation multiples (EV/ last 12 months (LTM) EBITDA) from December 31, 2022 to June 30, 2024. Average private equity multiples increased 0.7x (from 13.5x to 14.2x). Meanwhile, public market multiples increased 2.2x (from 14.4x to 16.6x). In fact, by June 30, 2024, private equity companies were being held at nearly a 2.5x discount as compared to public companies.
To us, the conclusion is clear. Public market performance was more heavily driven by multiples, not earnings. Public markets seemed to be valuing companies at higher valuation multiples than private equity despite public companies growing at half the rate of private equity companies. What all of this suggests to us is that private equity has the necessary ingredients to outperform public markets over the coming quarters. Our analysis suggests that private equity portfolio companies have generated better earnings and are held at lower valuation multiples than their public market peers. As these factors normalize, we expect private equity to benefit disproportionately.
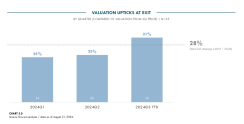
For our assessment above to hold true, we would expect that private equity valuations should have become increasingly conservative as public markets recovered over the past 18 months and private equity did not follow. If this is true, then the private equity “pop” at exit should be increasing during this period.
Recall in our whitepaper, from 2005 to 2023, the average “pop” at exit relative to two quarters prior was 28%.
Our analysis shows just this. In 2024Q1, 2024Q2 and 2024Q3 YTD, the average “pop” at exit relative to two quarters prior increased from 24% to 25% then to 31%, respectively.
The increasing valuation “pop” at exit would suggest that private equity valuations became increasingly conservative as public markets rallied and private equity valuations did not keep pace. As more liquidity events occur, we believe private equity returns may continue to benefit from these valuation upticks at exit.
Turning to Liquidity: Distributions on the Horizon?
Turning our attention from performance to distributions. It should come as no surprise that the past couple of years have seen a drastic decline in distributions to private equity investors. We know it has been bad, but what may surprise many is how bad it has really been.
We believe that prior cycles, and specifically the GFC, are also informative when it comes to understanding distribution patterns. We predicted in the spring that, after a period of historically low distribution activity, we thought the second half of the year would see an increased level of activity. See one of our other whitepapers “Liquidity May be on the Horizon” from June 2024 for more. And now, a couple of months into the second half of the year, we are seeing liquidity start to pick up.
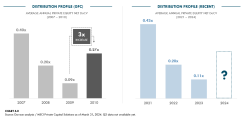
The cycle of a down market causing a drop in liquidity, and liquidity rebounding meaningfully after the trough, is something we have seen before in private equity. In fact, we saw a strikingly similar pattern during the GFC. See Chart 6.0. We focused on the drop in average distributions-over-carrying-value (DoCV). What we saw was that the pattern from 2007 through the trough in 2009 was mirrored during the most recent decline between 2021 and 2023. In fact, it was, once again, strikingly similar. Said differently, this cycle has seen a drop in distributions similar to what investors saw during the GFC.
The data shows that a mature basket of private equity assets returned 40% of its carrying value in 2007. Said differently, for every dollar one had in private equity, an investor received 40 cents back in distributions. It was a high liquidity year, the peak before the crisis. In 2008, distributions dropped to 20% of carrying value, and in 2009, this dropped further to 9%. Fast forward to 2021, 2022 and 2023, and the numbers essentially mirror the GFC at 43%, 20% and 11%, respectively. Strikingly similar figures to that of the GFC.
So, what happened next during the GFC? Following the drought in liquidity in private equity in 2009, liquidity rebounded drastically in 2010. Distributions increased from 9% of carrying value in 2009 to 27% in 2010, a tripling in liquidity. One might ask, could we see the same result starting in the second half of 2024? While we don’t expect the full year 2024 to be similar to 2010, given the slower deal activity in 2024H1, we do believe the market is positioning itself for increasing distribution levels in 2024H2 and 2025 and back to more normalized levels in the 20% to 30% range.
We believe the market certainly is showing signs that liquidity may be coming back. Alongside an environment of expected interest rate declines, leaders at many large global sponsors are on record with their views on the deal market making a comeback.
Final Thoughts
In conclusion, our analysis would suggest, absent a black swan event, that private equity could be in for a very interesting chapter in 2024H2 and 2025. To date, this cycle has been incredibly consistent with what we experienced during the GFC. Should history repeat itself, we believe private equity is well positioned to generate excess returns relative to public markets and distribution activity should increase materially over the next 12 to 24 months.
Legal Disclaimer: Based upon Dawson’s current views informed by published sources and third parties and no assurance can be made that historical trends will continue or that expectations will materialize. Past performance is not a guarantee nor necessarily indicative of future performance. MSCI Private Capital Solutions (MSCI) and S&P Capital IQ data represent all available data within certain criteria including geography, fund size and strategy. Different criteria would yield different results. Data in Chart 1.0, “Early Recovery”, “Dec ’22-Jun ’24”, “14%” and Chart 3.0, “Private Equity Index (MSCI)” is inclusive of a 2% estimated uplift for 2024Q2 based on all partner capital account statements received by Dawson as of August 31, 2024 given MSCI data for 2024Q2 is not yet available. Data in Chart 4.0, “Late Recovery” is from MSCI, while remaining “Private Equity Index” data in Chart 4.0 represents data from all companies within Dawson’s proactively priced universe where such data is available given that MSCI does not consistently track these metrics. Data in Chart 5.0 represents all YTD 2024 (through August) private equity exits of funds proactively priced by Dawson where data is available.