By Irina Pacheco, CFA, Quantitative Strategist and Portfolio Manager Multi-Asset Solutions, BMO Global Asset Management, and Michael Swope, CFA, Vice President, Manager Selection, Multi-Asset Solutions, BMO Global Asset Management
With extraordinary returns across international equity markets in 2017 investors could easily justify increased enthusiasm for passive investing. Why pay for active management when the MSCI EAFE Index is up over 25% and the MSCI Emerging Markets Index rises 37%? At the same time, most investors know that 2017’s high returns and low volatility were, indeed, extraordinary.
Market turbulence so far in 2018, however, is cause to pause and take a closer look at a subset of the investment universe BMO Global Asset Management calls “high-conviction” (HC) active strategies, and assess whether they offer measurable benefits versus index funds or low tracking error active strategies.
What is the high-conviction universe?
In our analysis, we used composite data as reported to Morningstar1, and focused on international developed markets and emerging markets. We used five different characteristics to identifying HC strategies: tracking error, beta, R-squared, upside/downside capture, and active share. The table below shows the filtering guidelines for each characteristic.

We established an overall HC universe by including composites that appeared in three out of the five groups created by these filtering guidelines. (Strategies that fell outside of these filtering guidelines are “non-HC” strategies.) To mitigate the concern that the same historical data used to create the HC universe was also used to measure its performance we imposed a high frequency (greater than 50% for all characteristics but active share) on how often a strategy was required to meet three of the filtering guidelines2. This gives us greater confidence the strategies selected would have populated the HC universe even if other time periods were used for filtering. Survivorship bias also affects our results, as underperforming composites may have exited the universe. In a sense, however, survivorship bias gives our results a more conservative tilt due to the upward pressure on the surviving strategies to outperform the benchmark and their peers.

Risk/return observations
In order to evaluate the HC universe, we examined the historical risk/return trade-off using an average of one- and three-year rolling returns versus annualized risk (standard deviation). All five filtering guidelines revealed HC strategies had higher average returns and lower standard deviation over rolling windows versus the full universe, the benchmark and an ETF3 designed to track the benchmark. Risk/return data is shown in the following charts:


Downside risk mitigation
HC strategies also offered advantages in terms of downside risk mitigation. We looked at the percentage of time three-year returns were in the bottom quartile of the full universe and found that HC strategies appeared in the bottom quartile less often than the non-HC strategies. Moreover, the maximum drawdown for HC strategies over 15 years was notably smaller than that of non-HC strategies (-34% versus -41% for international developed markets and -32% versus -47% for emerging markets). This result may be a bit surprising to investors who expect the median HC strategies to experience wider performance swings.
Getting in and staying in
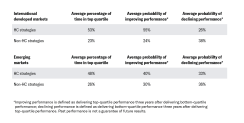
While they delivered top-quartile performance approximately 50% of the time, HC strategies did at times underperform their peer universe. We found that HC strategies exhibited a broader ranking dispersion and their performance sometimes placed them in the bottom quartile. However, that dispersion did not hurt longer-term performance in international developed markets, as the probability of delivering top-quartile performance in the three years following bottom-quartile performance was higher for HC strategies (55%) than for non-HC strategies (24%).
Conversely, the probability of delivering bottom-quartile performance in the three years following top-quartile performance was lower (26%) than that of non-HC strategies (38%). Within emerging markets, the difference in improving/declining probabilities was narrower between HC and non-HC strategies, but HC strategies still showed a strong performance advantage over the last 20 years, delivering top-quartile performance nearly 50% of the time versus 26% for non-HC strategies.
These results suggest that an underperforming HC strategy may present a buying opportunity for new investors. At the same time, the data underlines the importance of patience for current investors in an HC strategy. If an investor is confident in an HC manager’s process, it is inadvisable to steer away from that strategy during tough times, due to the greater probability of a strong rebound versus the wider universe.
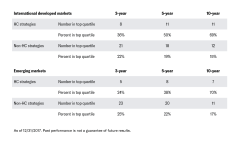
Lastly, we reviewed strategies in the top quartile for performance over three-, five- and 10-year periods. These results suggest that the HC universe could help investment decision-makers identify active strategies capable of outperformance over the long term. Within international developed-market equities, 69% of HC strategies delivered top-quartile performance over ten years, while just 15% of non-HC managers did so over the same time period. HC strategies in emerging markets displayed a similarly attractive probability of long-term outperformance versus non-HC strategies.
Patience preferred
Investors with a shorter time horizon or a low tolerance for bottom-quartile performance may have more difficulty with HC strategies. As we’ve seen, a short-term view of underperformance could overlook a buying opportunity while getting impatient with an HC manager could result in forfeiting a rebound. If an HC strategy is in the bottom quartile, a client may question its presence in his or her portfolio unless some larger context is provided. We believe this research illustrates the benefits of a longer-term philosophy by providing quantitative evidence that getting in and staying in during times of underperformance has a good probability of paying off.
The table below illustrates the advantages of adding exposure to HC strategies in allocations to international developed markets and emerging markets. For comparison purposes, we also added a sample allocation of 50% HC strategy/50% ETF3 (designed to track the index).
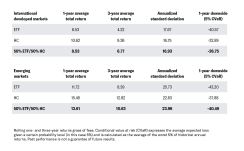
In both markets, the 50/50 allocation provided excess return, notably more than 2% over a three-year period, while reducing volatility versus the ETF alone. These results suggest HC strategies can help financial professionals add value in both portfolio construction and manager selection. As an additional benefit, the HC universe can isolate truly active strategies from “closet” index strategies and thus help clients optimize their fee budget for active management.
Access the full report and listen in on our podcast for more insights from the authors to help drive better conversations and better outcomes.
Disclaimers
1 Institutional separate accounts, gross of fees, with an inception date prior to 01/02/2012. Statistics for the HC universe and all subsets are calculated using the median monthly returns from 01/01/1998 to 12/31/2017. Composite information self-reported to Morningstar by the managers and has not been independently verified.
2 In international developed markets, 22 out of 141 strategies met the criteria. In emerging markets, 26 out of 132 strategies did so.
3 iShares MSCI EAFE ETF (inception 08/14/2001) and iShares MSCI Emerging Markets ETF (inception 04/07/2003). For the period prior to inception, the corresponding index was substituted to build a performance record of the same length as the other composites used in this analysis.
International developed markets data was filtered on the Morningstar Foreign Large Blend category. Emerging markets data was filtered on the Morningstar Diversified Emerging Markets category. Morgan Stanley Capital International Europe, Australasia, and Far East Index (EAFE) is a standard unmanaged foreign securities index representing major non-U.S. stock markets, as monitored by Morgan Stanly Capital International (MSCI).
The MSCI Emerging Markets Index is a market capitalization weighted index comprised of over 800 companies representative of the market structure of emerging countries in Europe, Latin America, Africa, Middle East and Asia. Prior to January 1, 2002, the returns of the MSCI were presented before the application of withholding taxes.
Investments cannot be made into an index.
BMO Global Asset Management is part of the BMO Financial Group, a service mark of Bank of Montreal (BMO). Certain companies within BMO Global Asset Management offer a number of products and services designed specifically for various categories of investors in a number of different countries and regions. These products or services are only offered to such investors in those countries and regions in accordance with applicable laws and regulations.
This is not intended to serve as a complete analysis of every material fact regarding any company, industry or security. The opinions expressed here reflect our judgment at this date and are subject to change. Information has been obtained from sources we consider to be reliable, but we cannot guarantee the accuracy. This publication is prepared for general information only. This material does not constitute investment advice and is not intended as an endorsement of any specific investment. It does not have regard to the specific investment objectives, financial situation and the particular needs of any specific person who may receive this report. Investors should seek advice regarding the appropriateness of investing in any securities or investment strategies discussed or recommended in this report and should understand that statements regarding future prospects may not be realized. Investment involves risk. Market conditions and trends fluctuate. The value of an investment as well as income associated with investments may rise or fall. Accordingly, investors may receive back less than originally invested.
Past performance is not necessarily a guide to future performance.
All investments involve risk, include the possible loss of principal.
Investment products are: NOT FDIC INSURED – NOT DEPOSITS – NOT BANK GUARANTEED – MAY LOSE VALUE
© 2018 BMO Financial Corp. (6911837, 4/18)