By: Ian Lyngen, Managing Director, Head of U.S. Rates Strategy
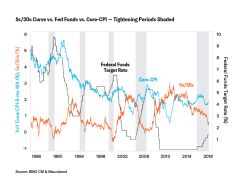
Many investors are anticipating that the return of inflation in the U.S. economy will ultimately lead to a re-steepening of the Treasury yield curve and a material increase of term premium; but that isn’t necessarily going to be the case. Using the difference between 5- and 30-year Treasury yields as a measure of investors’ need for higher rates to venture out the curve, we see that whenever core-CPI accelerates while the Federal Reserve is in the midst of tightening campaign, the curve actually flattens.
This is a story of Fed credibility. Its decision to normalize the balance sheet and hike rates in 2017, despite stubbornly low inflation, has put monetary policy well ahead of the realized inflation curve. As a result, the return of pricing pressure will only serve to increase the market’s willingness to price-in future Fed rate hikes. Central bankers in developed economies have a long and successful track record of combating inflation; deflation on the other hand, has proven a lot more challenging. A glimpse at a history of Fed policy versus inflation (as measured by core-CPI) shows that every tightening campaign since the late 1980s has led the 5s/30s flatter – in fact, to the point of inversion.
At BMO Capital Markets, we are skeptical of the sirens’ song arguing things are ‘different this time’ because Congress has finally delivered on the long-awaited corporate tax cut, and that the stimulative effects will propel inflation beyond benign levels seen throughout most of the recovery. While we’re conceptually onboard with the argument in theory, our primary concern stems from the 150 bp of tightening and balance sheet unwind the Fed has already delivered. Moreover, the borrowing needs of the federal government will press front-end yields even higher, triggering a supply-side tightening that risks more than offsetting any budding inflationary pressures.
In debating the merits on both sides of the flattening versus steepening narrative, we have recent price action to use as a guide. It is rare that the market offers a series of pivot points as informative in understanding the market’s current response-function to the key risks as those we’ve seen already during 2018. The combination of January 12 and February 13 releases of higher-than-expected core-CPI figures reinforced the traditional tie between late-cycle spikes of inflation and the shape of the curve (i.e. accelerating price pressures leads to more aggressive flattening – to the point of inversion). Within the same period, we’ve also seen a glimpse of the biggest risk to our flattening call in the form of a 10 percent correction in stocks – although a large portion of that has since been reversed.
The re-steepening risk is more universal than simply the performance of the equity market, and we’re comfortable expanding the proverbial net to include anything that materially tightens financial conditions. Tighter conditions could be triggered by a jump in borrowing costs as well; recall that every major equity market correction has been preceded by a dramatic increase of high yield spreads. More to the point, anything bringing the Fed’s rate-hike plans into question will steepen the curve. Many participants have worried that the recent correction in stocks would derail the Fed, but the Chairman attempted to assuage these fears by emphasizing that “we will remain alert to any developing risks to financial stability.”

The nuance between different steepening scenarios is that an event (credit, stocks, etc.) which triggers expectations for a ‘Powell Put’ will disproportionally benefit the 2-year sector. This implies an immediate end of rate-hikes driven by what is ostensibly an external shock. On the other hand, the 5s/30s curve is subject to steepening risks if and when the growth data (presumably inflation, as well) falls short of expectations. The logic here is that in such an environment, the probability of the FOMC achieving its 3.0 percent terminal rate target would decrease, thereby resulting in a Treasury market rally led by the 5-year sector. Point being, not all steepenings are created equal, and the impetus tells us as much about timing as it does direction.
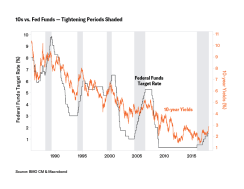
In addition to the shape of the curve, we also find history as a useful guide in disputing the bearish outlook for Treasuries, and it suggests the next stop for 10-year yields is 5 percent. During the last two Fed tightening cycles, 1999-2000 and 2004-2006, the back-ups in 10-year yields between the first hike and final hike were 64.4 bp and 61.3 bp, respectively. Since the Fed started the current round of rate hikes in December 2015, 10-year yields have increased 63.3 bp. Coincidence? We think not.
Looking back to the 1994-1995 campaign, the selloff was more dramatic, start to finish, at 178 bp. That said, unlike the current cycle, there wasn’t a mid-90s move comparable to the 2016 rally that “reset the clock” at 1.38 percent in 10s. Therefore, we’re comfortable drawing parallels between 178 bp in the 90s and 150 bp today. Said differently, in the current global rate environment the real conundrum would be if 10-year yields rapidly increase to greater than the 5 percent pre-crisis levels.