By Ian Lyngen, Head of U.S. Rates Strategy, BMO Capital Markets
As protectionism has defined the agenda in the Treasury market, the move toward a lower yield environment has been very telling. There are several potential genres involved in every trade dispute – is it a tragedy, satire, morality tale? Or is it all of them and more rolled into a saga? Chapter one is always higher prices to importers, typically followed by an attempt to pass along the increased costs to consumers. From here, the narrative invariably shifts to a) realized inflation and higher inflation expectations, b) profit compression as buyers cannot sustainably bear the elevated prices or c) a combination of the two.
As with so many things in the real economy, in practice very little is truly binary, and our base case in the event of an all-out trade war with increasingly costly tariffs is that pockets of imported inflation will be accompanied by profit-erosion in specific sectors. It’s too early to call the winners and losers, but suffice it to say, we would expect a different outcome for the U.S. economy had real average hourly earnings not been flat – or 0.0 for fans of Animal House. Said differently, we anticipate that supply-side inflation shocks will function as a tax on the consumer rather than produce the type of demand driven price pressures the FOMC would like to see at this stage in the cycle.
Should The Bonfire of the Levies reach its final chapter, it will end in one of two ways: with tax reforms spurring enough growth to offset any profit compression on the corporate side caused by tariffs, or firms controlling expenses via scaled down increases in payrolls/wages. The latter will lead not only to layoffs, but also, more broadly, a hit to consumer confidence (similar to the early signs we’re seeing on the business front), and curtailed spending. That certainly isn’t a first-order problem and, if anything, the prospects for a sector outside of shelter to contribute to inflation will only serve to embolden the Fed in its commitment to higher policy rates.
Regarding the curve flattening, the Fed giveth and the Fed taketh away, and apparently the FOMC was in a giving mood at the June meeting. The path has been cleared for the yield curve to continue flattening to inversion. The confirmation of the 25 bps per quarter “new norm” is a milestone that not only points toward further pricing of December’s meeting, but also March (and even June) 2019 as we progress through the data cycle in the approach to a September hike. This is very much in keeping with the notion that the futures market tends to price “two hikes and a pause” on a rolling basis, and suggests higher front-end yields are the path of least resistance.
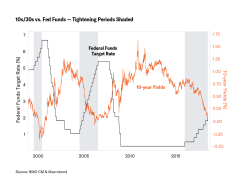
Inversion isn’t limited to the 2s/10s curve and, in fact, we find ourselves focused on 10s/30s as progress toward higher policy rates seems inevitable. The decision of the U.S. Treasury Department to keep the weighted average maturity of U.S. debt relatively unchanged, despite mounting net issuance needs, translates to far greater front-end borrowing – at least in outright auction size terms. Moreover, with the notion of an ultra-long Treasury bond tabled for the time being and TIPS viewed as an attractive sector in which to offer more securities, demand for the 30-year bond remains robust – both at initial offering and in secondary trading.
All of this combined creates a bias to see 10s/30s soldier on to zero and beyond. With inversion within striking distance, we’re left to ponder how negative 10s/30s could ultimately go, and what we should expect in terms of the length of the journey. For context, we examined the previous two instances when 10s/30s crossed the zero bound, first in 2000 and again in 2006. In the 2000 inversion, 10s/30s reach as inverted as -37 bps, and it took 245 trading days for the curve to turn positive after its initial drop below zero. In 2006, the magnitude and duration were less significant, with the lowest point being -6 bps and a duration of 33 trading days. We’re cognizant 2000 and 2006 were much different times than 2018, but nevertheless found the data to be interesting background on what to expect when the curve crosses zero. This, at best, amounts to food for thought as the Fed presses forward with its campaign of gradual normalization.