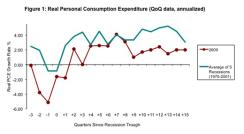
Growth in the U.S. has been weak compared to previous recoveries and although data has been a bit better of late, the country continues to occasionally flirt with falling into stall speed. One of the reasons for this anemic recovery is the weak level of government spending -- federal, state and local spending has detracted from GDP in nine of the eleven quarters since 2010 (something that has not happened since the mid-1950s). The other reason has been the relatively sluggish growth of consumer spending, which accounts for roughly 70 percent of U.S. GDP (see Figure 1, below). Watching the pace of income growth in the U.S. will be key to determining if the economy is bouncing around a new lower level of potential growth, or breaking out of the range in one direction or another.
Breaking Down Consumer Spending Growth
In parsing the nature of consumer spending in the U.S., it is useful to break it down into its constituent parts: nominal consumer spending is equal to personal income, minus taxes and savings, plus/minus the amount of credit taken out/paid down. Nominal consumer spending can then be deflated by a consumer price index to arrive at real personal consumption expenditures.
One oft-cited reason for the weak performance of the U.S. consumer is deleveraging. However, deleveraging has not really taken the form of less spending on credit (total consumer credit as a proportion of spending is only about 2 percent lower than it was during the boom of the mid-2000s). Neither has it been a result of higher taxes (taxes as a proportion of income have dropped since the crisis, which has helped disposable income).
Also, while we’ve recently seen some improvement in consumer spending numbers, the relative weakness compared to past recoveries has actually been cushioned by a savings rate that has been plunging lower over the past 2 years; down to 3.3 percent of disposable income from nearly 6 percent in 2010. Had the US consumer kept savings constant at that latter rate, rather than dis-saving, we calculate that GDP growth would have averaged about 0.40 percent lower over the period.

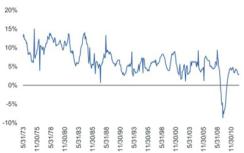
This leaves personal income as the prime culprit of the weak growth in consumer spending when compared to previous recoveries. Indeed, the data shows a much weaker recovery in disposable personal income (i.e. personal income minus taxes) than seen in previous cycles. Moreover, the trend is clearly secular in nature, as the long-term chart of yearly changes in disposable income illustrates (see Figure 2).
Watching Income Trends
In rough terms, then, it is reasonable to expect that the overarching trend for 70 percent of the economy will be set by the underlying growth in income, while changes in the savings rate and credit conditions will create the volatility around that trend-line. What then is occurring with the trend? There are several sources of personal income, so watching the composition of income can provide a good view.
Firstly, wages account for a large proportion of changes from month-to-month, although the second largest source of volatility in month-to-month income is transfer payments. Also, it is important to keep in mind that an increasing number of unemployed individuals are falling off the eligibility list for transfer payments, which will put downward pressure on income from that segment.
Looking more closely at the compensation component, we observe a worrying pattern over the past couple years, as there have been several swoons into negative growth territory with income (not exactly the picture of a healthy economy). Indeed, if one were to see sustained negative momentum in this measure, a double-dip recession would not be far in the offing. Since compensation, in rough terms, is equal to hours worked multiplied by hourly earnings, watching those two statistics will be the best litmus test for the health of income going forward. October data for these metrics (released November 2) is not terribly encouraging, as average hourly earnings came in flat (and below consensus) for the month, and the average workweek was revised slightly lower.
Overall, as we have stated, the fate of consumer spending will have a fundamentally important impact on the trajectory of economic growth in the years to come, and in a fascinating turn of events throughout the recent recovery the corporate sector has been thriving in an environment where the economy, in general, has not. Of course, this is the great economic Catch-22 of our time, since corporate sector investment and continued strength will be highly dependent on the recovery in consumer spending, which may be hampered if compensation remains weak. In the future, we plan to look further into the personal consumption patters of wealthy households in the U.S., since that demographic holds an outsized impact on the trajectory of the economy overall.
Chart sources: Data in Figures 1 & 2 from Bloomberg and BlackRock.
Sami Mesrour, CFA, is a portfolio manager on BlackRock’s Asset Allocation Model-Based Fixed Income Portfolio Management Team.